
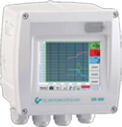
A chart recorder can collect millions of values without improving one maintenance decision. The difference between useful measurement and digital storage is a defined response: who reviews the trend, what condition triggers action, and how the plant verifies the result. For compressed-air and gas systems, the DS 500 provides a practical platform for display, recording, alarm handling, and evaluation, but the measurement plan remains an engineering responsibility.
At Jams (Pvt.) Ltd, we begin a DS 500 discussion with questions, not channel count. Is the plant trying to reduce non-production flow, protect a dryer specification, compare compressor performance, allocate gas consumption, or warn about falling header pressure? Each objective needs a different sensor map, recording interval, and action rule.
Build a measurement chain, not an instrument collection
The DS 500 can accept multiple analog and digital sensors, including flow, dew point, pressure, temperature, current, and compatible third-party signals. Manufacturer options allow up to twelve sensor inputs, with a seven-inch touch display, data storage, relay functions, network interfaces, and an optional web server. These capabilities make it a central station for a utility measurement package.
More channels are not automatically better. Every channel should have a tag, unit, normal range, source, calibration responsibility, and reason for being recorded. A useful compressor-house map might combine:
- Delivered flow from a VA 500 or another correctly selected consumption meter.
- Main-header pressure at a point representative of plant supply.
- Pressure dew point downstream of the dryer and, where justified, at a critical user.
- Compressor electrical power or current with an understood measurement boundary.
- Dryer or compressor state signals that explain changes in the trends.
Without state context, a sudden flow increase could be a leak, a new shift, a blow-cleaning cycle, or a compressor-control test. The recorder does not know which explanation is correct unless the architecture supplies the necessary context and the reviewer understands operations.
Choose recording intervals from the event
A one-minute interval may show a shift profile but miss a fast pressure collapse. A one-second interval may capture the event but create unnecessary data for a monthly consumption report. Some applications need separate treatment: faster acquisition for alarms and transients, plus aggregated values for routine dashboards.
Define how long each phenomenon lasts. Compressor load/unload cycles, pneumatic machine peaks, dryer switching, and pressure disturbances may require short intervals. Cost allocation, daily totals, and baseload review can use longer summaries. Keep raw data long enough to investigate exceptions, and preserve report totals according to the plant’s energy or quality procedure.
Convert curves into specific questions
A trend review should not become a meeting where people admire charts. Use repeatable questions. What was the lowest stable flow after production stopped? Did pressure remain inside the agreed band? Did dew point cross the warning threshold, and for how long? Did compressor power rise without corresponding delivered flow? Which change started first?
Overlay related variables on the same time base. Flow and pressure together can reveal a demand peak. Power and flow support a specific-performance calculation. Dew point, dryer state, and flow can show whether a moisture excursion follows switching or overload. Correlation is a lead for investigation, not proof of cause, so follow the trend with field checks.
Design alarms around response
An alarm with no owner becomes background noise. For each threshold, state the delay, hysteresis, severity, recipient, permitted acknowledgement, and required response. A momentary dew-point spike may not justify the same action as a sustained excursion. A low header-pressure warning during a planned shutdown should not be treated like one during full production.
- Set an advisory threshold early enough for an operator to investigate.
- Add an appropriate persistence delay so normal transients do not flood the alarm list.
- Use a higher-severity limit only where a defined operational or quality consequence exists.
- Record acknowledgement and corrective action outside the recorder if the plant maintenance system is the official workflow.
- Review nuisance alarms and deadbands after enough representative operation has been observed.
Relay outputs can support annunciation or interlocking where the approved design permits, but a recorder should not be turned into an undocumented safety system. Critical shutdown functions require the correct risk assessment, architecture, and validation.
Protect data quality during commissioning
Check each value from sensor to screen. Confirm sensor range, units, decimal placement, scaling, wiring, Modbus address, and tag description. For a 4-20 mA channel, simulate or compare more than one point so a scaling error is visible. For a totaliser, verify pulse weight or digital register and make sure resets are controlled.
Synchronise the DS 500 clock with the systems used for compressor state, power, and production. Record configuration backups and firmware context under the site’s change procedure. If remote access is enabled, involve the plant’s IT and cybersecurity teams rather than placing the recorder on a network as an informal convenience.
Create an action rhythm
We normally recommend three review horizons. Operators watch current values and actionable alarms. Maintenance or utilities teams review daily and weekly exceptions, baseload, and open work. Energy or plant management reviews monthly normalised indicators and approved savings calculations. The same data supports each level, but the questions and detail differ.
A closed loop looks like this: detect an exception, validate the data, inspect the equipment, raise work, complete the correction, and compare an equivalent operating period. Keep pressure, production, weather where relevant, and shift conditions visible when stating an improvement. This prevents a normal production reduction from being presented as an energy project result.
Reports that plant teams can use
- A daily exception sheet listing threshold exceedances and data-quality gaps.
- A weekly compressed-air baseline chart with production state and unresolved leak work.
- A monthly consumption total by agreed measurement boundary.
- A compressor performance view combining flow, power, and pressure on aligned timestamps.
- A dew-point compliance summary showing duration, not only the worst instantaneous value.
Keep the number of reports small enough that someone reads them. A well-named export with units and date range is more valuable than an elaborate dashboard whose calculation basis is unknown.
Local application support
JAMS can review sensors, channel count, panel or wall-mount requirements, signal interfaces, recording intervals, alarms, and the handover procedure. Our measuring-technology capability covers the complete measurement question, not only the recorder. Genuine CS Instruments supply and support in Pakistan are described in our authorisation information.
Frequently asked questions
Is DS 500 a PLC or SCADA replacement?
It is an intelligent chart recorder and evaluation platform with inputs, display, storage, alarms, and communication options. It can centralise a measurement package, but plant control, safety, and enterprise historian requirements may still belong in PLC, SCADA, or other validated systems.
How many sensors should we connect?
The platform can be configured for multiple inputs, but select channels from the decisions required. Four well-defined, synchronised variables can be more useful than twelve poorly named values. Confirm exact hardware options and sensor loading during design.
Can it calculate energy savings automatically?
It can support calculations, totals, and reports, but a defensible saving needs a baseline, comparable operating conditions, agreed energy rates, and documented boundaries. Engineering review is still needed before a displayed difference becomes a financial claim.
What is the first commissioning test?
Trace every channel from physical sensor to displayed and recorded value. Verify units, scaling, timestamps, alarm response, and exported data. Then observe the complete system through representative operating states before relying on reports.