
Plants do not improve because they own more sensors. They improve when trustworthy measurements trigger clear decisions, work orders and verification. A flow trend can reveal off-shift consumption, a dew-point alarm can protect a process, and an acoustic survey can identify repair work—but only if responsibilities and thresholds are defined around the data.
Jams (Pvt.) Ltd helps industrial teams move from isolated instruments toward practical measurement programmes. The objective is not a dashboard with the highest tag count. It is a manageable connection from sensor condition to maintenance action and, finally, to an operational KPI that people understand.
Begin with business and maintenance questions
Gather operations, utilities, maintenance, quality and automation representatives and list the questions that repeatedly cause delay or debate. Where does compressed-air demand rise outside production? Which dryer excursions threaten the required air quality? Which water-treatment dosing point drifts between manual checks? Which branch loses pressure during peak demand?
Rank questions by consequence, actionability and measurement feasibility. A sensor should have a named decision owner and a likely response before it is purchased. If no action can follow a threshold, the measurement may be informative but it is not yet a maintenance control.
Create a measurement hierarchy
Use layers rather than trying to instrument every asset at once:
- Plant boundary: main utility production or incoming total, used for overall balance.
- Area boundary: department, line or major process, used to assign demand and locate changes.
- Asset measurement: a critical machine or treatment package, used for condition or control.
- Campaign tools: temporary loggers, portable instruments or leak imaging used to investigate a finding.
The hierarchy helps teams distinguish a permanent KPI meter from a diagnostic device. It also reveals gaps: a main total without branch context can show deterioration but not where to send maintenance.
Make data quality an explicit maintenance task
Every measurement point needs an asset record containing its purpose, model and serial details, location, range, units, reference conditions, output scaling, configuration backup, installation drawing and service history. Assign an owner for physical inspection and another, if necessary, for control-system data.
Automated quality rules can flag flat lines, impossible values, sudden step changes, communication gaps or values outside the configured range. These flags do not prove sensor failure; they initiate a check. Compare suspicious data with process state before issuing an instrument work order. A zero flow during a planned shutdown is valid, while the same zero during full production may not be.
Build baselines that include operating context
A baseline should cover a representative period and record production, shifts, shutdowns, weather where relevant and major equipment states. Save the meter configuration and calculation method alongside the trend. If units or base conditions change later, the baseline must be restated or clearly separated.
For a new programme, one high-quality baseline is more useful than ten unverified charts. Review whether totals reconcile approximately across the hierarchy, allowing for timing, measurement uncertainty and unmetered branches. Large unexplained imbalance is itself a data-quality or system question.
Translate measurements into work-order triggers
A trigger should specify threshold, persistence, context and response. “High air flow” is weak. “Area B flow remains above the agreed off-production threshold for 30 minutes while the line status is stopped” is actionable. The resulting workflow can ask an operator to confirm status, then open a maintenance inspection if the condition is real.
Avoid generating alarms for every minor variation. Repeated nuisance notifications teach teams to ignore the system. Start with a small number of consequential triggers, tune them using actual operating data and preserve a route for human judgement.
Choose KPIs that maintenance can influence
Useful measurement-program KPIs may include:
- off-production utility demand at defined plant or area boundaries;
- specific utility consumption per stable production unit;
- percentage of critical measurement points passing data-quality checks;
- time from validated exception to assigned work order;
- verified closure rate for leak or loss findings;
- repeat failure rate by component or location; and
- time inside agreed pressure, dew-point or water-quality limits.
Do not reward discovery alone. A team can report hundreds of leaks while repairing none. Pair findings with verified closure and system-level trend. Likewise, avoid using raw utility consumption to compare periods with very different output; use a suitable denominator and keep the definition stable.
Connect the programme to daily and weekly routines
Daily review should focus on exceptions that need immediate confirmation. Weekly review can examine trends, work-order progress and recurring patterns. Monthly or quarterly governance can check KPI definitions, calibration or service status, improvement projects and whether the sensor network still reflects the plant layout.
Include production and operations in the review. Maintenance cannot close an air isolation opportunity if the line must remain pressurized for operational reasons. Equally, production may not know that a small change in cleaning practice creates a large utility peak until the trend is explained.
Use products as parts of an architecture
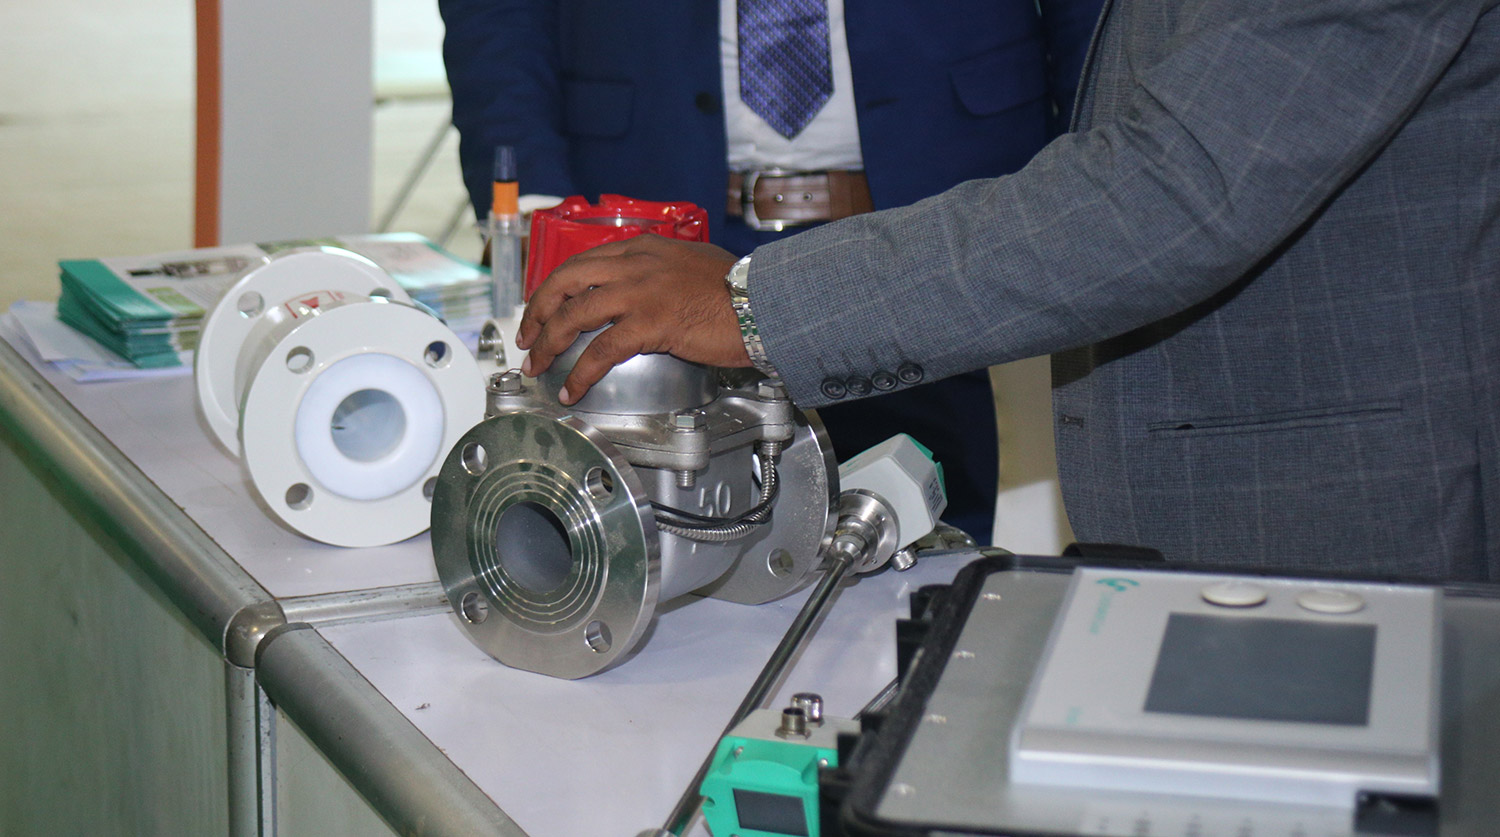
The JAMS measuring-technology offering and broader product portfolio can support flow, compressed-air quality, leak detection and related industrial duties. Selection should follow the medium, range, environmental conditions, required evidence and communication architecture. A familiar product is not automatically appropriate for a new point.
Plan naming, units, time synchronization, network security, data retention and backups before large-scale rollout. Decide what continues to work if the network is unavailable. A critical local alarm may need to remain independent of a cloud or central dashboard.
Roll out in controlled phases
- Pilot: select one important question, verify one or two points and prove the work-order loop.
- Stabilize: correct installation and data-quality issues, then agree thresholds and ownership.
- Expand: add area or asset points where the pilot shows a clear decision benefit.
- Standardize: adopt common asset records, units, naming, commissioning sheets and review cadence.
- Audit: periodically retire unused tags, reassess thresholds and confirm that KPIs still drive action.
This phased method creates evidence for further investment and limits the burden on automation and maintenance teams. It also makes shortcomings visible while the system is still small enough to correct.
Keep claims tied to verified evidence
A measurement programme can reveal and support improvement, but it does not guarantee a specific saving or uptime result. Changes in production, tariffs, weather, pressure or equipment strategy can affect the numbers. Separate measured values, engineering estimates and financial assumptions in every report. Verify completed work with the same boundary and comparable operating context.
To discuss a pilot, contact JAMS with the plant question, available measurements, process conditions and desired system interface. We can help shape the instrumentation and commissioning scope while the plant retains ownership of maintenance priorities and operational decisions.
Frequently asked questions
How many sensors are needed to start a measurement programme?
There is no minimum network size. Start with enough verified points to answer one important question and locate action at a useful boundary. One main and one branch measurement may teach more than a large ungoverned rollout. Expand after the data-to-work-order loop functions.
Who should own measurement KPIs?
Ownership is usually shared. Utilities or operations may own performance, maintenance owns corrective work, automation owns data transport and quality may own compliance limits. Name one accountable KPI owner while documenting supporting roles so exceptions do not stall between departments.
How often should KPI thresholds be changed?
Change them when process requirements, production patterns or validated evidence justify it—not whenever performance is uncomfortable. Keep revision history and re-evaluate baselines after material changes. Frequent undocumented adjustment destroys comparability and can hide deterioration.
Can existing plant sensors be used before buying new ones?
Often yes, if their suitability, installation, configuration and data quality are checked. Review range, units, calibration or service status, location and signal scaling. Existing data can define the pilot and reveal where a new point is genuinely required.