
Compressed air is purchased as electricity but consumed as flow. Between those two points sit compressor controls, dryers, filters, receivers, pressure drops, leaks, artificial demand, and production schedules. If a plant records only compressor running hours or the monthly electricity bill, it cannot reliably tell which department used the air or whether a maintenance action changed demand. A correctly applied thermal mass flow meter closes that information gap.
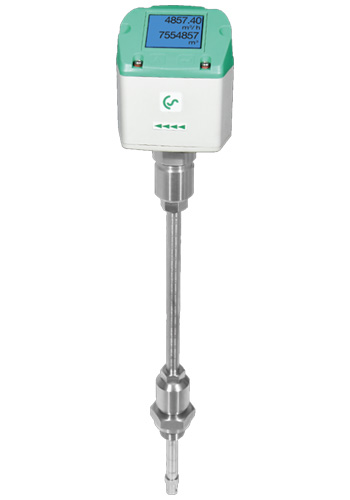
The VA 500 flow meter is an insertion-style consumption sensor for compressed air and suitable gases. From an applications-engineering perspective, its value is not a single live number on the display. The value is a trustworthy time series of flow and total consumption, collected at a location where the result answers a defined energy or production question.
What thermal mass measurement contributes
A thermal mass sensor measures the cooling effect of gas passing its heated sensing element. With the correct gas and reference conditions configured, the instrument reports standardised volume flow or mass-related consumption without a separate pressure and temperature compensation package for ordinary thermal applications. There are no rotating turbine parts in the flow stream, and the wide measuring span is useful when a line sees both production peaks and low idle demand.
This does not remove the need for sound engineering. The pipe internal diameter, insertion depth, orientation, gas composition, flow direction, and available straight run affect the installation. Contamination or condensate can also compromise a sensor intended for clean gas service. We first establish whether the point contains dry compressed air, wet air, oil carryover, or a technical gas, then verify the selected instrument and mounting arrangement against the manufacturer’s data.
Start with a decision, then choose the meter location
“We want to save energy” is too broad to define a measurement point. A main-header meter answers how much air the compressor station supplies. A branch meter answers how much a department consumes. A machine-level point can reveal the demand profile of a critical asset. Each is useful, but none can substitute for all the others.
- Compressor-house discharge: use flow alongside electrical power and pressure to examine system efficiency and control response.
- Department branches: compare shifts, products, or cost centres while keeping reference conditions consistent.
- Critical machines: identify peak demand, idle consumption, and whether a process change alters air use.
- Remote or low-use areas: expose flow that continues when production is stopped and isolation should have reduced demand.
For an insertion sensor such as the VA 500, a representative velocity profile is essential. Avoid placing the probe immediately after a bend, partially open valve, reducer, or other disturbance unless the approved installation arrangement provides sufficient conditioning. Confirm that the probe length suits the pipe and that safe insertion or removal through the intended valve assembly is covered by the site procedure.
Turn flow into compressed-air energy indicators
Flow alone tells the demand side of the story. To assess generation, align it with compressor electrical power, header pressure, and operating state. A useful indicator is specific power: the electrical input associated with a defined delivered flow under stated reference conditions. The exact calculation boundary must be declared. Including dryer, cooling fan, or auxiliary loads in one period but not another creates a misleading comparison.
At departmental level, totalised volume over a shift or production batch is usually more useful than one instantaneous reading. The plant can normalise consumption against metres of fabric, tonnes processed, packages filled, or machine hours. We advise starting with a small number of indicators that operators and managers can explain:
- Average and peak flow during productive operation.
- Baseline flow during a defined non-production window.
- Total consumption per shift, batch, or production unit.
- Header pressure at the same timestamps.
- Compressor power and specific power where the required electrical data is available.
Use the load profile, not just the monthly total
Two months can have the same total consumption and very different problems. One may show sharp peaks that pull down pressure and force an additional compressor to load. The other may show a steady night-time baseline caused by leaks and equipment left connected. Trend resolution should be fast enough to reveal the events that matter, while reporting intervals should remain manageable for the engineering team.
Look for recurring shapes. A high flow before the first production start may indicate manual blow-off, drainage, or machines being pressurised too early. A slow decline after shutdown can point to isolation practices. A saw-tooth profile may follow compressor control or a large cyclic consumer. These are hypotheses to investigate, not automatic diagnoses from the meter alone.
Commission the measurement chain
A reliable energy decision depends on more than sensor installation. Check the actual pipe internal diameter rather than relying only on nominal size. Confirm flow direction, immersion depth, gas selection, reference conditions, engineering units, totaliser settings, and output scaling. If the value is sent by 4-20 mA, pulse, or Modbus to a PLC or recorder, verify the receiving channel against the local display over several operating points.
Time synchronisation matters when flow is compared with compressor power or production records. So do tag names and units. “Flow_1” and an unlabeled totaliser will become difficult to interpret six months later. Record the physical location, serial information, configuration, output map, calibration status, and the date of any change.
Avoid common interpretation errors
- Do not compare standard cubic metres with actual line-volume readings without reconciling reference conditions.
- Do not call all off-shift flow “leakage”; dryers, drains, control air, or essential users may legitimately remain active.
- Do not claim savings from a lower flow if production, pressure, or shift duration also changed.
- Do not allocate cost by branch readings until meter locations and totalisers have passed a basic balance and plausibility check.
- Do not ignore the low-flow range when the main objective is to see idle demand.
From first survey to permanent measurement
A temporary logging campaign can establish the likely value of permanent metering. Once the plant knows which decisions recur—cost allocation, leakage control, compressor optimisation, or capacity planning—it can standardise tags, reporting periods, and review responsibilities. The instrument then becomes part of operations rather than a display that only the energy manager checks.
JAMS helps Pakistani plants review the measurement objective, pipe and gas conditions, installation hardware, signal integration, and reporting plan. Our broader measuring-technology support can connect flow with pressure, dew point, leak findings, and data recording. Genuine supply and local support for this product family are covered through our CS Instruments relationship.
Frequently asked questions
Can a VA 500 prove the performance of one compressor?
It provides the delivered-flow side of the calculation. A defensible compressor assessment also needs synchronised electrical power, pressure, operating state, and a clearly defined system boundary. Flow by itself cannot show whether an efficiency change came from the compressor, its controls, or plant demand.
Where should the first meter be installed?
Choose the point that answers the highest-priority question. A main header is logical for system supply; a departmental branch is better for accountability; a machine branch is better for a specific process. Accessibility, straight run, gas condition, and safe mounting must also be acceptable.
Can night flow be treated as leakage?
Only after legitimate users are identified. Dryer purge, automatic drains, instrumentation, and processes that continue overnight all contribute. Establish an operating-state register, isolate zones where practical, and use leak detection to explain the remaining baseline.
How often should the meter be checked?
Use the manufacturer’s calibration and maintenance guidance, plus plant-specific risk. Periodically inspect the mounting, compare the signal at the receiving system with the display, review zero or idle plausibility, and document any change to diameter, gas, scaling, or reference conditions.